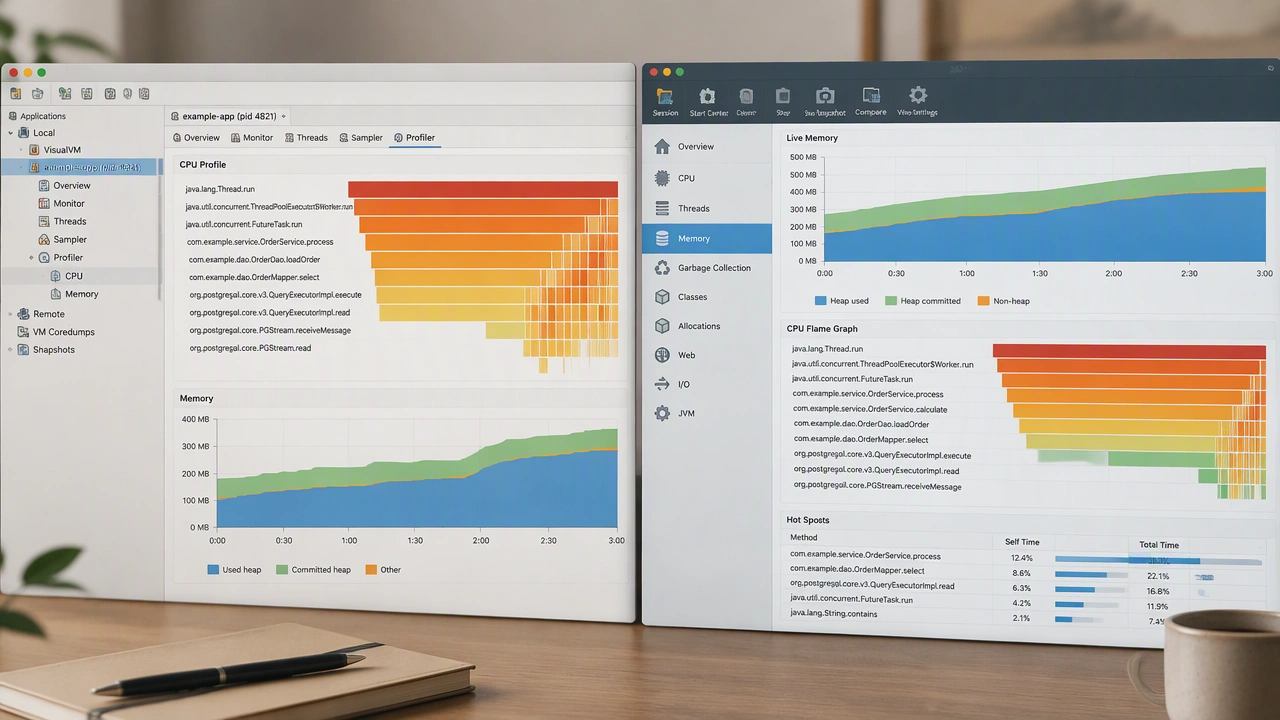
Profiling is the cornerstone of performance optimization, and Java offers powerful tools to inspect your running applications. VisualVM provides free, real-time monitoring of CPU usage, memory allocation, and thread activity. JProfiler goes deeper with method-level profiling, hot spot detection, and garbage collection analysis. In this topic we walk through setting up both tools, connecting them to local and remote JVMs, and interpreting the results. You will learn how to identify expensive methods, spot memory leaks, analyze thread contention, and understand GC pause patterns. We also cover best practices such as profiling in staging environments, comparing snapshots before and after changes, and avoiding the trap of premature optimization by letting data guide your decisions.