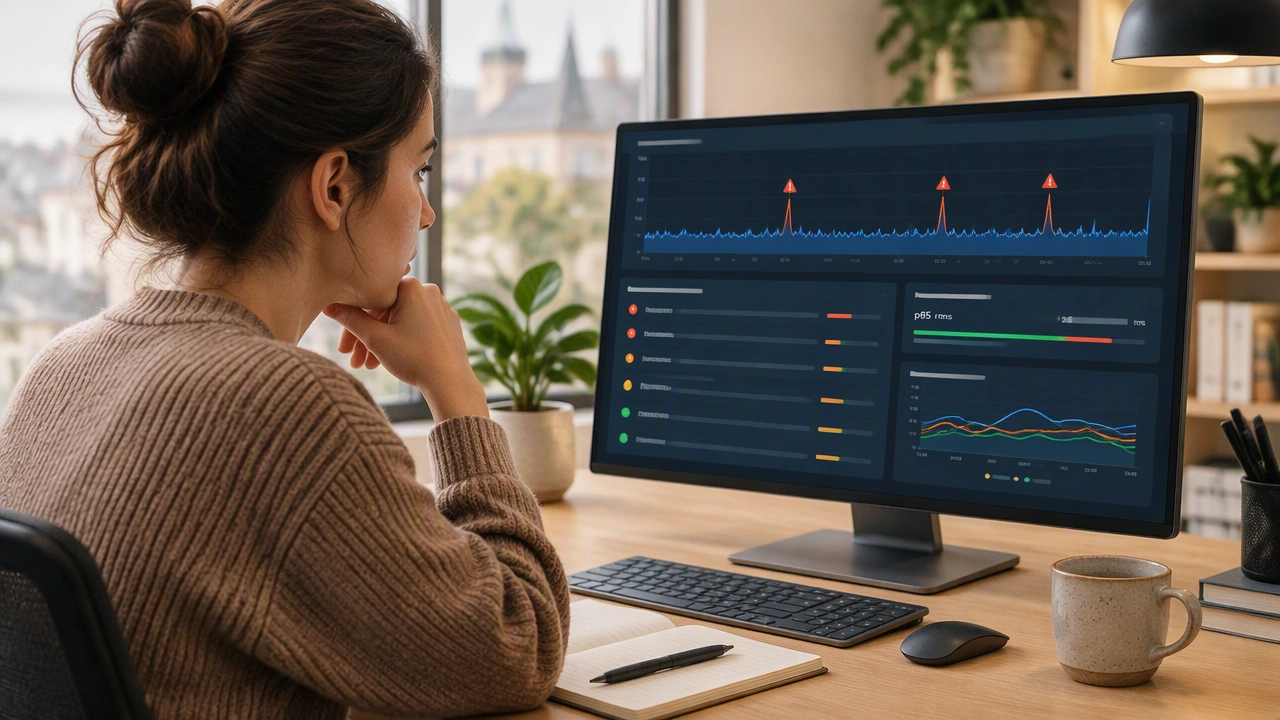
How to Set Latency Alerts That Reduce Noise: Practical Performance Tuning for Monitoring

Latency monitoring is one of the most direct ways to protect software speed. When response times creep upward, users notice immediately. Yet many teams struggle with alert fatigue because their latency alerts fire constantly, often on normal variation rather than genuine problems. The goal is not more alerts but better ones. In this article, you will learn how to set latency alerts that reduce noise while still catching meaningful changes that affect user experience and system performance.
This is a form of performance tuning. Rather than optimizing code in isolation, you are tuning your observability layer so it highlights real issues, gives you actionable context, and avoids wasting engineering time on false positives.
Why Latency Alerts Often Create Noise
Noisy latency alerts usually come from a few common patterns:
- Static thresholds that ignore context: A fixed threshold like 500 milliseconds may be too tight during peak traffic or too loose during quiet periods.
- Alerting on raw averages: Averages smooth out spikes and hide tail latency. You can have a healthy average and still have 5 percent of users experiencing slow responses.
- Missing seasonality: Many systems have predictable patterns. Without accounting for daily or weekly cycles, alerts fire on expected behavior.
- Per-request alerts instead of aggregate signals: Alerting on every individual slow request creates a flood of notifications that obscure systemic trends.
Each of these leads to unnecessary pages, wasted time, and growing distrust in the monitoring system. The fix is not to disable alerts. It is to design them around meaningful signals.
Define What “Meaningful” Means for Your System
Before configuring any alert, clarify what a meaningful latency change looks like in your environment. This requires understanding your baseline and your users.
- Identify critical user journeys: Login, checkout, search, and API responses that drive downstream systems are higher priority than background tasks.
- Set service-level objectives: A service-level objective, or SLO, gives you a concrete target. For example, you might define that 99 percent of checkout requests should complete within 800 milliseconds over a rolling 30-day window.
- Understand acceptable variance: Some fluctuation is normal. Define a range that your team considers healthy so alerts only trigger when behavior moves outside that range.
When your alerts are anchored to user impact and business goals, they naturally carry more meaning and create less noise.
Use the Right Aggregation Window
The time window you choose has a large effect on alert quality. A one-second window on a low-traffic endpoint can produce erratic results. A five-minute window on a high-traffic service may hide a real spike.
- Match the window to traffic volume: Low-traffic endpoints need longer windows to produce stable signals. High-traffic services can use shorter windows safely.
- Avoid single-moment decisions: Require a condition to persist for several consecutive windows before firing. This reduces the impact of brief, harmless fluctuations.
- Consider a recovery condition: Define when an alert should resolve. If latency returns to normal, the alert should clear promptly so on-call engineers are not distracted by stale issues.
A well-chosen window captures real trends without reacting to momentary noise.
Alert on Percentiles, Not Just Averages
Percentile-based alerting is one of the most effective ways to reduce noise while improving detection of user-impacting slowdowns.
- p50 (median): Useful for understanding typical user experience.
- p95: Captures the experience of slower users without overreacting to extreme outliers.
- p99: Important for catching tail latency issues that affect a small but meaningful portion of traffic.
If your p95 latency rises from 400 milliseconds to 700 milliseconds, that is a meaningful change even if your average barely moves. Alerting on the p95 gives you visibility into the experience of users who are most affected by slowdowns.
A practical approach is to set separate thresholds for each percentile and tune them independently. This prevents a single number from doing all the work and gives you more precise signals.
Apply Baseline Comparison Instead of Fixed Thresholds
Static thresholds are simple but limited. A more robust approach compares current latency to a baseline that reflects normal behavior.
- Compare to the same time yesterday or last week: This accounts for daily and weekly patterns without complex modeling.
- Use a rolling baseline: A 7-day rolling average or median gives you a stable reference point that adapts slowly to gradual changes.
- Alert on deviation from baseline: For example, fire an alert when the current p95 is more than 30 percent above the baseline for 10 minutes. This catches genuine regressions while tolerating normal variation.
Baseline comparison is especially effective for systems with predictable traffic patterns. It reduces noise by ignoring changes that are part of normal behavior.
Add Context to Every Alert
An alert without context forces an engineer to start investigating from scratch. Adding a few details at the alert level dramatically improves response quality.
- Service and endpoint name: Make it immediately clear what is affected.
- Current value and threshold: Show the actual latency number so the responder can judge severity quickly.
- Trend direction: Indicate whether latency is rising, stable, or recovering.
- Related changes: If a deployment, configuration change, or traffic shift occurred recently, include that information in the alert or link to a dashboard.
Context-rich alerts reduce mean time to resolution because engineers spend less time gathering basic information and more time diagnosing the root cause.
Layer Your Alerts by Severity
Not every latency change deserves a page. A tiered alert structure helps your team respond proportionally.
- Warning level: A moderate deviation from baseline that should be reviewed during business hours. This might route to a team channel or a ticket queue.
- Critical level: A significant and sustained deviation that is likely affecting users. This should page the on-call engineer.
- Emergency level: Extreme latency combined with elevated error rates or system-wide impact. This may trigger an incident response process.
By separating alerts into tiers, you ensure that the most urgent issues get immediate attention while less severe changes are tracked without disrupting the team.
Continuously Tune Your Alerts
Alert configuration is not a one-time task. Systems evolve, traffic patterns shift, and user expectations change. Treat your alerts like code.
- Review alert history regularly: Look for alerts that fire frequently without leading to action. These are candidates for adjustment or removal.
- Track alert quality metrics: Measure the percentage of alerts that result in meaningful investigation. A healthy ratio might be 70 percent or higher.
- Involve the team: On-call engineers who respond to alerts have the best insight into what is useful and what is noise. Build a feedback loop.
- Test changes gradually: When you adjust a threshold or window, run the new configuration in warning mode first to observe its behavior before enforcing it.
Regular tuning keeps your monitoring system aligned with reality and prevents the slow drift toward alert fatigue.
Bringing It Together
The most effective latency alerts share a few qualities. They are anchored to user impact, built on stable statistical signals, rich with context, and tuned over time. When you follow these principles, you learn how to set latency alerts that reduce noise and surface the changes that truly matter.
Start by defining service-level objectives for your most critical user journeys. Replace static thresholds with baseline comparison. Move from averages to percentiles. Add context to every alert. And commit to ongoing tuning as your system grows.
With this approach, your monitoring becomes a tool that accelerates performance tuning rather than a source of constant interruption. You spend less time chasing false alarms and more time improving the speed and reliability of your software.